A Look at Buyer Purchasing Power with Rates at Historic Lows
One of the main factors in the recent surge in home sales is that mortgage rates continue to stay around historic lows keeping a traditional buyers purchasing power at high levels. At some point in the near future conventional wisdom leads one to think that rates will eventually have to rise for the benefit of the whole economy.
I thought this would be a good time to look at the difference in payment for a purchaser if interest rates escalate and how it could impact the market. It is also a great tool for those of you who are beginning the search for a home.
Some people feel this is an excellent time to make a long-term purchase due to these rates and also unload a property that you will be selling in the next 3-5 years. The record low interest rate not only aides the buyer but also the seller who has been saved in a further drop in property value during the great recession.
The economy is showing signs of rebounding and consumer confidence in the California home market is on an upward trend. However, will the market be able to sustain an eventual hike in interest rates when salaries are not increasing?
As you will see below, a purchaser’s payment is impacted quite a bit by even a half-a-percentage point increase and the banks are very strict in staying within the confines of the maximum amount a purchaser can qualify for based on a % of the purchaser’s gross income which is usually in the 36-41% range**. Please note that property taxes, insurance and other liabilities factor into this and you are strongly advised to speak to a licensed lender about the process since this information can and will fluctuate. I am happy to put you in touch with some of the best lenders in the business and we are happy to address any questions you may have.

*Click Image to Enlarge
This blog has moved
This blog is now located at http://skinnerestates.blogspot.com/.
You will be automatically redirected in 30 seconds, or you may click here.
For feed subscribers, please update your feed subscriptions to
http://skinnerestates.blogspot.com/feeds/posts/default.
February Sales Data For Single Family Homes + Analysis

-click on the above image for an enlarged view.
Quick Analysis:
*The most expensive sale of the month 1141 Summit Drive in Beverly Hills sold for $16.5 million. The 16,800 sq. ft. home sitting on one acre debut on the market in September of last year for $23.5 million. . .a 30% hair-cut from the original listing price.
*The second most expensive purchase was made by Alethia Research and Management (high-net worth money management firm) founder Peter Eichler for $15,000,000. The Malibu Road home boasts 4,459 sq. ft. and is brand new construction. . .
*Other than the high-end sales above, activity above 5 million still remains light. No sales in the high-end neighborhoods of Manhattan Beach, Pacific Palisades, Brentwood and Santa Monica surpassed the $3.4 million mark according to the MLS.
*Most sales recorded under a million dollars were on the market for less than 30 days.
*With the exception of Cheviot Hills and Manhattan Beach most areas saw a healthy increase in sales compared to February of last year.
Chase Bank By Far the Worst at Finalizing Loan Modifications
The nonprofit news group ProPublica reported yesterday that 97,000 homeowners have been stuck in trial loan modifications for more than six months under the government’s anti-foreclosure program, which was supposed to generate permanent modifications after three months.
60,000 of those 97,000 borrowers have their mortgages with JPMorgan Chase & Co. . .WOW. . .can you say extend and pretend. . .
Rents down about 9-13% in North Santa Monica Since 2008
With vacancy rates continuing to rise in Santa Moncia, rents in the 90402 and 90403 zip codes are down about 9-13% since 2008. According to Westside Rentals, around 280 1 bedroom apartments are for rent in these high priced zip codes.
After a slow three month period, local landlords have seen activity has pick-up dramatically the last few weeks and rental rates are expected to stabilize at the current rates through the spring and summer months.
Commercial Note: Cali Hotel Market Yet To Hit Bottom
California’s hotel market was late showing up to the foreclosure party but their arrival was inevitable. The median price per room is down 30% from 2008 and 38% from 2007. Most hotels presently on the market are still priced too high to sell and Atlas Hospitality Group another 10-20% drop in 2010.
Lenders in 2009 continued to delay processing the foreclosure of distressed hotels, opting instead to extend the forbear in order to defer the reporting of their losses. Although REO hotels made up 73% of the 2009 sales transactions, the majority of distressed hotels have still not been sold.
Foreclosures will dominate the market in 2010 and that is welcome news to developers who turn a profit by converting struggling hotels into condos and/or timeshares. Conversion happens to prime coastal hotels during every recession.
Sources: California Hotel Sales Survey Year-End 2009 and First Tuesday Journal
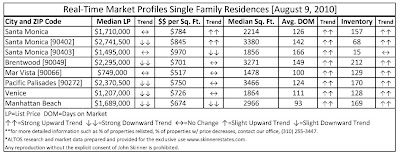
Westside Neighborhoods Based on Price Per Square Foot Since 2007: Between 15% to 30% in losses
Here’s an overall snapshot of Westside neighborhoods based on Single Family Residences and their performance over the last 2 years ranked from highest in decline to lowest decline based on price per square foot. These type of losses help explain why many buyers are out testing the market right now despite the fact that some of the losses are only 1/3 of the average for LA County…Is it too early to buy in some of these neighborhoods? The current activity of buyers would lead us to believe it is not…if only we had a crystal ball.
1) Malibu 90265 ($734/sqft) -29.7% (2008-2009)
2) Marina del Rey 90292 ($506/sqft) -28.9%
3) Pacific Palisades 90272 ($728/sqft) -22.5%
4) Venice 90291 ($712/sqft) -22.4%
5) Beverlywood 90034 ($456/sqft) -21.5%
6) Culver City 90230 ($467/sqft) -20.6%
7) Santa Monica 90405 ($676/sqft) -19.9%
8) Santa Monica 90403 ($811/sqft) -19.4% (2008-2009)
9) Santa Monica 90402 ($876/sqft) -19.3%
10) Westwood 90024 ($616/sqft) -18.8%
11) Brentwood 90049 ($654/sqft) -17.8%
12) Beverly Hills 90211 ($621/sqft) -17.6%
13) Rancho Park 90064 ($547/sqft) -17.2%
14) Mar Vista 90066 ($531/sqft) -16.2%
15) Bel Air 90077 ($572/sqft) -15.5% (2008-2009)
16) West LA 90025 ($599/sqft) -14.8%
Comparatively, the entire County of Los Angeles corrected over 41.3% in Price Per Square Foot since 2007. . .
*Sources: DataQuik, MLS, Westside RE Meltdown


