Skinny On Real Estate
Homeowners are Optimistic Amid Mixed Signals
A recent survey conducted by the Home Buying Institute showed that homebuyers expected marked improvements in home prices over the next few years. Activity on the Westside is certainly showing optimism with open houses buzzing with people and multiple offers being the buzz phrase throughout the summer. At our first open house two weeks ago in Westwood on Fairburn Ave., we had over 60 parties attend and we were in escrow with multiple offers within a week of hitting the market.
The summer survey by HBI asked 25,000 consumers how they felt about the value of their homes, and an overwhelming 69 percent stated that they expected their home price to rise in the next 24 months. Some of this optimism could be due to a brighter Standard & Poor’s Case/Shiller Home Price Index, according to HBI.
The most current S&P Home Index stated that home prices had risen for the second consecutive month in several cities.
“This is a seasonal period of stronger demand for houses, so monthly price increases are to be expected and were seen in 16 of the 20 cities,” explained Index Committee chairman David Blitzer.
However, an abundance of foreclosure and shadow properties could curb rising home values. The vast number of bank-owned properties may continue to drag home prices down, as demand lags behind inventory in many regions.
Unsteady unemployment rates and increased difficulty qualifying for mortgages may also work against these positive housing market indicators, the source reports.
Source: Home Buying Institute
Buyers Should be Aware of Mortgage Fees
Record low interest rates are helping to spur a little bit of a housing comeback. Who knows whether the comeback will last but one this is for sure: record low interest rates are helping create a ton of buzz in the residential market. However, consumers must be aware that what you see advertised may not necessarily be the case and buyers should be aware of mortgage fees that could bump up their monthly payments.
Those that provide homebuyer education stress that fees can make a considerable difference in the cost of a home loan, and that buyers should be educated on how they impact a sale. Savvy individuals should look not just at the interest rate, but also at the APR, or annual percentage rate.
Consumers should also be aware that many of these fees are negotiable. While closing procedures differ in every region, some fees can be paid by or split with the sellers, according to The Federal Reserve Board.
If you have any further questions about this topic, please feel free to call our office at 310-255-3447.
1910 Fairburn Avenue, Los Angeles 90025
NEW LISTING
Open Sunday, July 24th 2-5
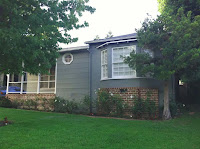 Phenomenal opportunity to own a charming 3 bed/2 bath home located on one of Westwood’s most desirable streets. Character and warmth fills this traditional style home with beautiful dark hardwood floors throughout.
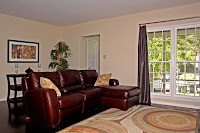 Spacious living room with fireplace and built-in shelves, formal dining room w/ French doors leading to back patio and private landscaped back-yard. Large
 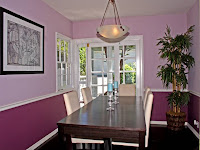 master suite with French doors to back-yard and front bedroom with bay window. Laundry inside off kitchen. Updated plumbing. Easy walk to Century City shopping center, dining, houses of worship and much more. Located in the Westwood Charter school district!
Visit Virtual Tour: 1910FAIRBURN.com
In-Depth Look at Single Family Sales in June –Manhattan Beach Leads the Way
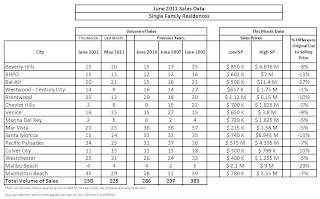 Total Single Family Residence “SFR” sales on the Westside and Manhattan Beach were higher than May (258 vs. 225) but still trail last year’s June output (286). Though sales have slowed down we must remember that last summer buyer’s were incentivized with tax credits that are no longer in play. The average % difference between original list price “OLP” and sale price is still shrinking. In some areas such as Bel-Air and Malibu Beach where the difference was over 25%, quite a few homes that were on the market for over 9 months finally sold and were originally priced way too high. If you take those numbers out, the average difference ends up being around 6%.
Home sales under a million dollars are on fire right now and garnering a lot of attention. Buyers are taking advantage of record low interest rates and want to get into the market before the conforming loan limit of $729,000 is pushed back to $625,000 on October 1st. 2039 Linnington Ave. in Westwood came on the market late last week for $985,000 and reportedly had over 200 people at the Open House. An appropriately priced home that does not require a lot of work does not have much competition in the current marketplace and should sell quickly with favorable terms to the seller.
A quick glance at the numbers shows that Manhattan Beach had a phenomenal month in terms of sales volume and blew away all the other areas we cover with 45 sales! This is a higher number than the sales volume during the peak bubble year of 2005. 11 of the homes sold at asking or higher than the OLP. 19 sold for 1-7% below OLP and 14 sold 8%-16% above OLP.
Pacific Palisades had a very solid month selling 9 more homes than it did last month and the sales numbers were roughly the same as the peak bubble years. Six of the sales were above the OLP and 17 sold within 4% of the OLP.
Santa Monica is still dragging along in terms of sales volume with ½ as many sales as in 2010, 2007 and 2005. However, the average sales price is staying consistent and if you eliminate two homes that sold way below OLP, the difference between OLP and sales price is only 5%.
A look at a few individual sales:
1021 Wellesley and 1025 Wellesley– Brentwood- These two 10,130 sq. ft. lots were purchased together creating a once in a blue moon opportunity to have almost a ½ acre of flat land north of Wilshire. The properties were listed for $2.050M and sold for $2.510M, 23% above the list price. Over time this will be an incredible buy as flat lots like this are extremely rare. 10 to 15 years from now this buyer will look like a genius.
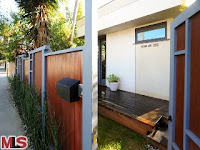 2317 Ocean Ave– Venice- A great case study in comparison to 2007 prices. This 2+2, 1,280 sq. ft. home on a 2,700 sq. ft. lot was built in 2007. It is situated just south of Venice is in a bit of a hectic location but the amenities of the beach and Abbot Kinney are a small walk away. This house sold for $1.033M after being on the market for 79 days. It was originally listed for $1.195M. In 2007 it was bought for $1.235M. Since 2007 the value for this home has dropped 19.5%.
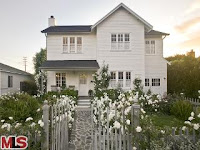 3665 May Street– Mar Vista- Another good case study. This classic New England farmhouse is a 4+3, 2,467 sq. ft. home on a 5,850 sq. ft. lot just north of Venice Blvd. The house is in great condition and sold for the list price of $1.580M in just 9 days. The house was sold in 2006 for $1.512M showing that prices seem to be holding around 2007 prices for this type of home in Mar Vista.
 32052 PCH & 20962 PCH– Malibu Beach- Oops! These two houses had seller’s and possibly agent’s who were out of touch with reality when originally listing these homes, especially 20962 PCH. This 2+1 is a tear-down located on Las Flores beach on a 7,928 lot. It took over 3 years to sell and was originally listed at $9.950M before finally selling on June 6th for $2.950M! 32052 PCH a 4+4 on a 18,300 sq. ft. beach situated on a private street above El Matador beach in very good condition was originally listed in 2009 for $4.0M and finally sold after 562 days for $2.1M!
Condo/Townhouse Sales Data for June
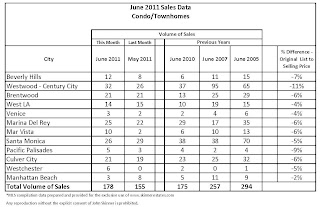 23 more units were sold compared to last month with Mar Vista, Westchester and Westwood showing the most improvement over the previous month. The average loss from OLP for all areas combined was only 5.92%. This is further evidence the market is an even playing field as the difference between OLP and sales price was around 10% this time last year. Though sales were up over last month they are still off by 65% in comparison to 2005. For some perspective, Westwood had the most sales with 32 this month…in June 2007, Westwood had 95 sales!
Market Falling into Consistent Pattern
According to Altos’ market action index we have multiple areas that show stability several years in a row. The # 30 is a representation of a baseline for equal supply and demand, based on the absorption rate of inventory. For purposes of this post we are using Pacific Palisades as an example. Most of the areas we cover on this blog are trending in the same manner.
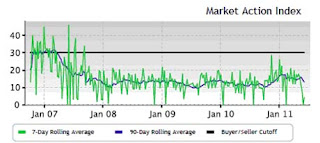 Although this graph shows there is quite a bit more inventory than there are buyers, it also clearly shows (look at the darker line for the 90 day rolling average) that we have had very consistent activity for over 3 years! On the graph you will see where the MAI was in January, 2008. Take a line and draw it straight across to today’s MAI. The inventory has been stable for about three years. It may appear be a buyer’s market, but the inventory that is there, is steadily and consistently absorbed.
As of July 1st: California Law Requires Carbon Monoxide Detector
California residents must have carbon monoxide detectors in their homes as of July 1, 2011. This timeline applies only to single-family homes that have appliances that burn fossil fuels or homes that have attached garages or fireplaces. For all other types of housing, such as apartments and hotels, detectors should be in place as of January 1, 2013. Types of fossil fuels include wood, gas and oil.
Detector
According to the senate bill, the detector must sound an audible warning once carbon monoxide is detected. It also must be powered by a battery, or if it is plugged in, have a battery for a backup. The detector also must be certified by national testing labs, such as the Underwriters Laboratories. The packaging on the carbon monoxide detector will state this. If the CO detector is also a smoke detector, it must still meet the above standards and must sound an alarm that is different than the smoke alarm. Carbon monoxide detectors typically can be purchased for about $20 and up.
Exemptions
Although the law targets units that are occupied by humans, the law exempts state and local government property, as well as property owned by the University of California Regents. The law requires local jurisdictions to comply; however, they may amend their current ordinances to fall more in line with the law.
Fines
California law states that anyone who does not comply with the law may face a $200 fine. However, residents will receive a notice of 30 days to correct any violations before they will be fined.
Links to Articles You Should Read
- Sales of $20-million-plus L.A. homes are rising
According to the LA Times a diamond-encrusted lining is emerging in Southern California’s cloudy real estate market.At least a half-dozen Westside mega-estates have sold for more than $20 million so far this year — creating a deafening buzz in local realty circles. Only a few home sales in other Southland counties have surpassed the $20-million mark.
- Banks gearing up to fill looming gap in jumbo loans
Fannie Mae, Freddie Mac and the FHA are facing an upcoming cutback in mortgage limits, but banks say they’re planning to expand their jumbo loan business in high-cost housing markets, according to the LA Times. - Pending Home Sales Turn Around in May
Pending home sales rose strongly in May with all regions experiencing gains from a year ago, pointing to higher housing activity in the second half of the year, according to the National Association of Realtors. - Obama administration boosts aid for unemployed homeowners
An interesting article from the LA Times on how unemployed homeowners with government-insured mortgages will be allowed to miss a year of payments while they try to find a job which is not only good for the economy but will help lower the number of foreclosures on the market.
A quick look at some recent Westside sales
Brentwood
310 Avondale Ave. a 3+3, 2,927 sq. ft. fixer in Brentwood Park with a lot size of 2,927 square feet, listed on 5/25 at $2.99M and sold quickly for $3.15M. $155K above asking price
Santa Monica – only 7 homes have sold as of 6/23 – of those, 4 went for over asking!
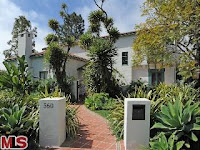 560 16th St. a 4+4, 3,128 sq. ft. remodeled 1930’s Spanish style home on a large 11,670 lot, went on the market 4/8/11 for $3.798 and sold in 2 months above asking for $3.940M
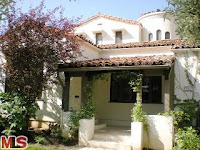 740 21st Place– A rare foreclosure/bank owned property North of Montana. This 4+4, 2,913 sq. ft. Spanish house on a 8,940 sq. ft. lot with a pool in solid condition sold right away and over asking. The bank was smart to price this property attractively. It was listed for $2.299M and sold on 6/10 for $2.325M. The property was bought in 2004 by the foreclosed owner for $2.180M.
Pacific Palisades – in comparison with Santa Monica, a much busier month thus far with 26 homes selling since 6/23. Most homes sold near or over asking price.
733 El Medio Ave. a 2+2.5, 1,495 sq. ft. house on a 6,920 sq. ft. lot was put on the market on 4/25/11 and sold on 6/1/11 for $1.1M which was 16% above the original list price of $950K. This house was a fixer/teardown and sold for lot value.
Culver City-
11343 Utopia– PHENOMENAL BUY: A 2+1, 905 sq. ft. house on a 8,088 sq. ft. lot was originally listed for $629K in November 2010 and finally sold as a short sale for $300K. It was bought in 2003 for $449K. A great Culver City market as a whole has not dropped nearly that far.
South Bay Sales Trends Since March-May 2009
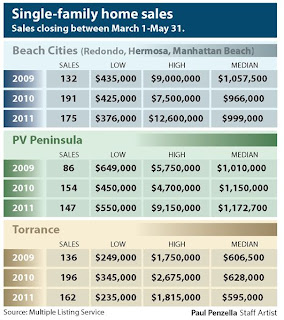
Here is a chart that appeared in last week’s Daily Breeze comparing sales data in the South Bay between March 1st and May 31st over the past three years.
Looking only at the 3-month period, Manhattan Beach had a median price down 1% from 2009 while the whole of the Beach Cities region was down 5% from ’09.
(*Source: Manhattan Beach Confidential, chart – Daily Breeze)


